pydecode.ChartBuilder
Note
This section gives a formal overview of the use of ChartBuilder. For a series of tutorials and practical examples see Tutorials.
Examples
import pydecode
import numpy as np
items = np.arange(10)
chart = pydecode.ChartBuilder(items)
chart.init(items[0])
chart.set(items[1],
          [[items[0]]],
          labels=[0])
pydecode.draw(chart.finish(), labels=True)
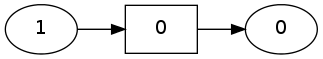
Computes
\[f(w) = (\bar{1} \otimes w(0)) \oplus (\bar{1} \otimes w(1)) \oplus (\bar{1} \otimes w(2))\]
chart = pydecode.ChartBuilder(items)
chart.init(items[0:3])
chart.set(items[3],
          [[items[0]], [items[1]], [items[2]]],
          labels=[0,1,2])
pydecode.draw(chart.finish(), labels=True)

Represents
\[f(w) = (\bar{1} \otimes \bar{1} \otimes \bar{1} \otimes w(0))\]
chart = pydecode.ChartBuilder(items)
chart.init(items[0:3])
chart.set(items[3],
          [[items[0], items[1], items[2]]],
          labels=[0])
pydecode.draw(chart.finish(), labels=True)

Same functions using set_t.
chart = pydecode.ChartBuilder(items)
chart.init(items[0:3])
chart.set_t(items[3], items[0:3], labels=np.arange(3))
pydecode.draw(chart.finish(), labels=True)
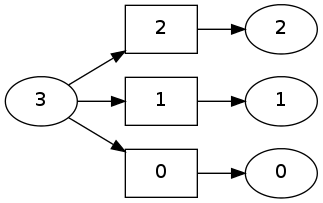
chart = pydecode.ChartBuilder(items)
chart.init(items[0:3])
chart.set_t(items[3], items[[0]], items[[1]], items[[2]],
            labels=np.array([0]))
pydecode.draw(chart.finish(), labels=True)

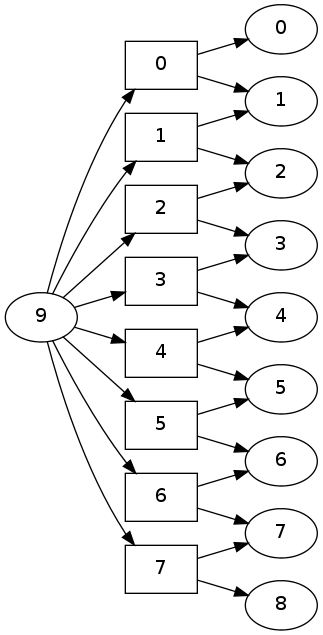
A more interesting use of set_t.
chart = pydecode.ChartBuilder(items)
chart.init(items[0:9])
chart.set_t(items[9], items[0:8], items[1:9], labels=np.arange(8))
pydecode.draw(chart.finish(), labels=True)